
AI Innovation
LLM ROILLM Infrastructure ROI
Know what local models save you.
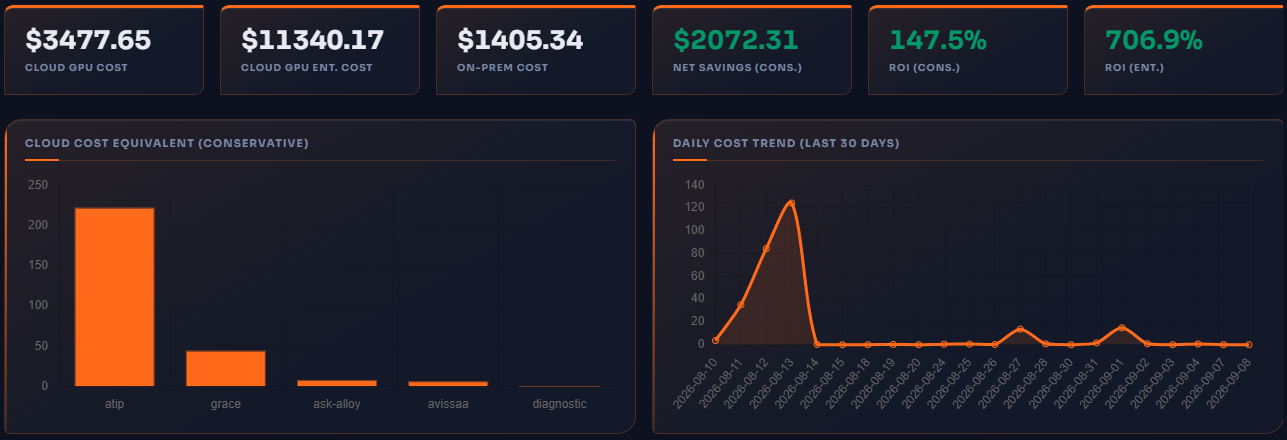
Tracks the cost and time savings AlloyGRC AI features produce against traditional manual effort, updated in real time, and compares on premises GPU spend with cloud GPU instances and per token commercial model pricing, both projected from actual token consumption.
Sovereign AI, priced
Running models inside your boundary is a security decision first. This dashboard makes it a budget decision too. Every projection updates in real time and can be broken down by app, system, user or model, over a window you set yourself.
The same number security bought you, now the number finance wants to see.
How it works
How a token turns into a dollar figure
The stages that turn raw model usage into the cost and ROI numbers on the dashboard.
STAGE 01
Usage collection
Token consumption is collected as AI features are used, tagged by model, application, system and user.
Usage log by model, app, system and user
STAGE 02
Cost projection
Usage is priced two ways at once: against on premises GPU cost, including an amortized hardware cost, and against the commercial per token pricing of each model.
Projected cloud GPU and API cost, single GPU and multi GPU
STAGE 03
ROI calculation
Projected cost is weighed against traditional manual effort to produce a cost savings figure and a percentage ROI, refreshed in real time as usage changes.
Cost savings figure and ROI percentage
Pipeline detail pending confirmation from the team that owns the cost model.
At a glance
KPI cards for the numbers leadership asks for
$4,200
Projected cloud compute cost, single GPU
$15,600
Projected cloud compute cost, multi GPU
$2,100
Amortized on premises hardware cost
$1,827
Savings due to use of On-Premise GPU
87%
ROI on Local verses Commercial Cloud Compute
$1,509
Savings due to use of On-Premise LLMs
Illustrative dashboard. Card types are real, the values are invented.
Every way that matters
One dashboard, broken down four ways
Both cost projections, cloud GPU and per token API, are cut by the same four dimensions, over whatever window you set.
Cut by
-
By app
Which application drove the usage and the cost behind it
-
By system
Which system ran the workload, for tracing cost back to infrastructure
-
By user
Who generated the usage, down to the individual
-
By model
Token usage broken out model by model, not blended into one total
Illustrative dashboard. Chart types are real, the data shown is not.
What you can do
-
Pull a savings figure for a leadership update
-
Compare on premises GPU cost against cloud GPU instances and per token pricing
-
Filter any breakdown or chart to a custom date range
Seen in the app
The real thing, on synthetic data
AI Innovation
Also in this area
Plain English in, real answers out, on your hardware
How it all fits togetherLLM Infrastructure ROI has more to show than fits on this page yet. A full walkthrough with visuals is being written. Ask for a demo to see it running today.
Put a number on sovereign AI.
Ask for a demo and see the comparison for an environment like yours.