
AI Innovation
GENAI DASHBOARDSGenAI Dashboards
Type a sentence. Get a dashboard built from your own data.
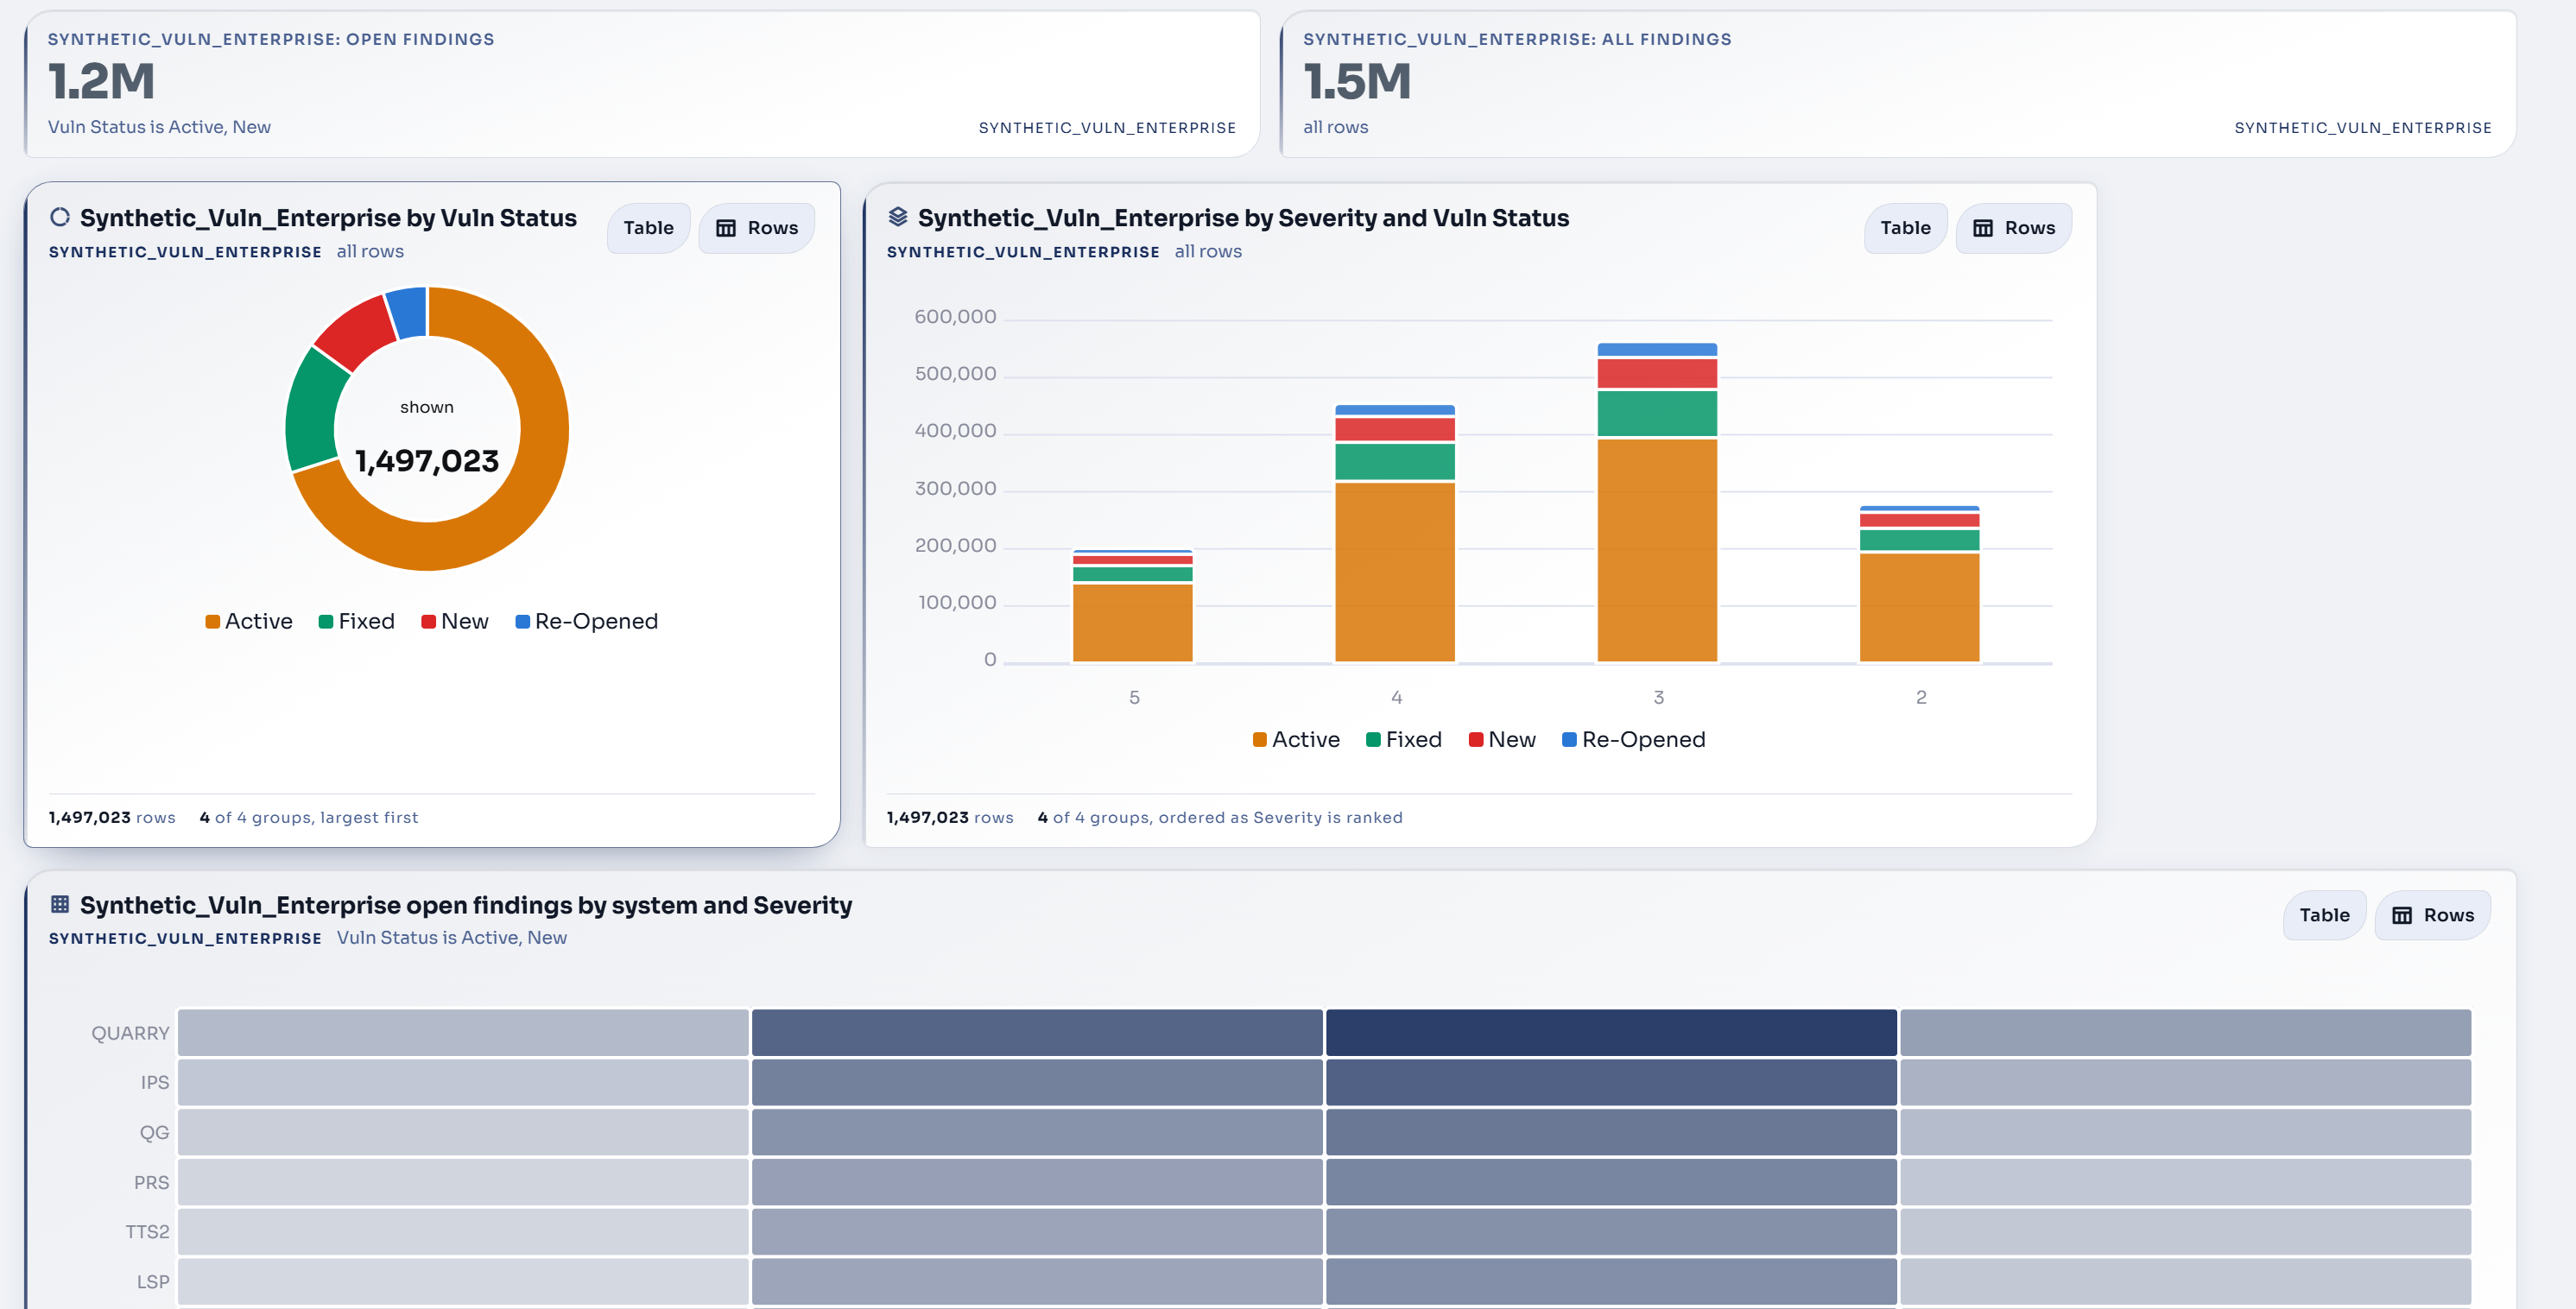
One written request becomes a board of KPI tiles, charts and tables. The model decides what the board looks like. The code computes every number on it.
Exploited findings by system, and how they split by severity
Exploited, outstanding
312
Systems affected
3
By system
By severity
Top findings
| CVE | Systems | Assets |
|---|---|---|
| CVE-2025-31324 | 3 | 41 |
| CVE-2025-24813 | 2 | 27 |
| CVE-2024-21762 | 2 | 19 |
Illustrative board. Synthetic values.
The rule
The model picks the shape. Code computes every number.
There is no path in which model output becomes a figure, a label or a row. That is what makes a generated dashboard safe to put in front of an Authorizing Official.
01
Your sentence
Name the data you want and how to cut it. Say by system for a per system breakdown, or name a shape: line, pie, scatter, heat map.
A request
02
The plan
One model call returns a plan of tiles: dataset, chart type, group by, split, filters, period, title. Each tile is checked against the vocabulary the model was handed. A tile that does not parse is refused, never repaired.
Validated tile plan
The only model step03
The counting
Every tile is filled by one of a handful of counting primitives, scoped to the systems you are cleared for. Which primitive fills a tile is decided from the column, never by the model.
Real figures
04
The board
Drawn, and yours to keep: save it, share it, or pin it as the opening board for a role so the first thing an executive sees is the board you chose.
Saved, shared, pinned
Thirteen shapes
Ask for a shape by name
If the data cannot feed the shape you asked for, the board says why and draws the shapes the data can feed. A line over a text column, a scatter of a status: it tells you rather than pretending.
KPI
One headline number
Bar
Counts by category
Stacked bar
Counts by category, split again
Donut
Share of the whole
Pie
Share of the whole, as slices
Treemap
Share of the whole, as sized boxes
Heatmap
Density across categories
Radar
Categories around a wheel
Table
The rows themselves
Line
A count over time or order
Area
A line with the volume filled
Histogram
How a number is spread
Scatter
Two numbers against each other
Three ways onto the page
The opening board
Loads before you type anything: one headline number per dataset and the most telling tile of each. Built entirely in code, or pinned by a curator for your role.
A dataset summary
Press a dataset's button or ask for a summary. A backbone of tiles is built in code from the dataset's roles; the model may add a few more on columns it judges telling.
A plain request
Anything else. The planner reads the sentence and returns the tile plan above. Example prompts on the page show the phrasings that work best.
From Ask Alloy
An answer in the drawer can become a board with the same filters, without the model being asked again.
It draws from every dataset published in the Dataset Builder that your role may open. Adding a data source is a Builder action, not a code change.
What you can do
Name the data you want, for example vulnerabilities, compliance, assets or ATO, so the right collection is selected
Say by system or per system for a per system breakdown
Save a board you like, share it, or pin it as the opening view for a role
Confirm any figure against the underlying page before you brief it
Straight answers
Ask for a board. Get one.
Ask for a demo and type your own question at a synthetic dataset. Then pin the result as your opening board.